
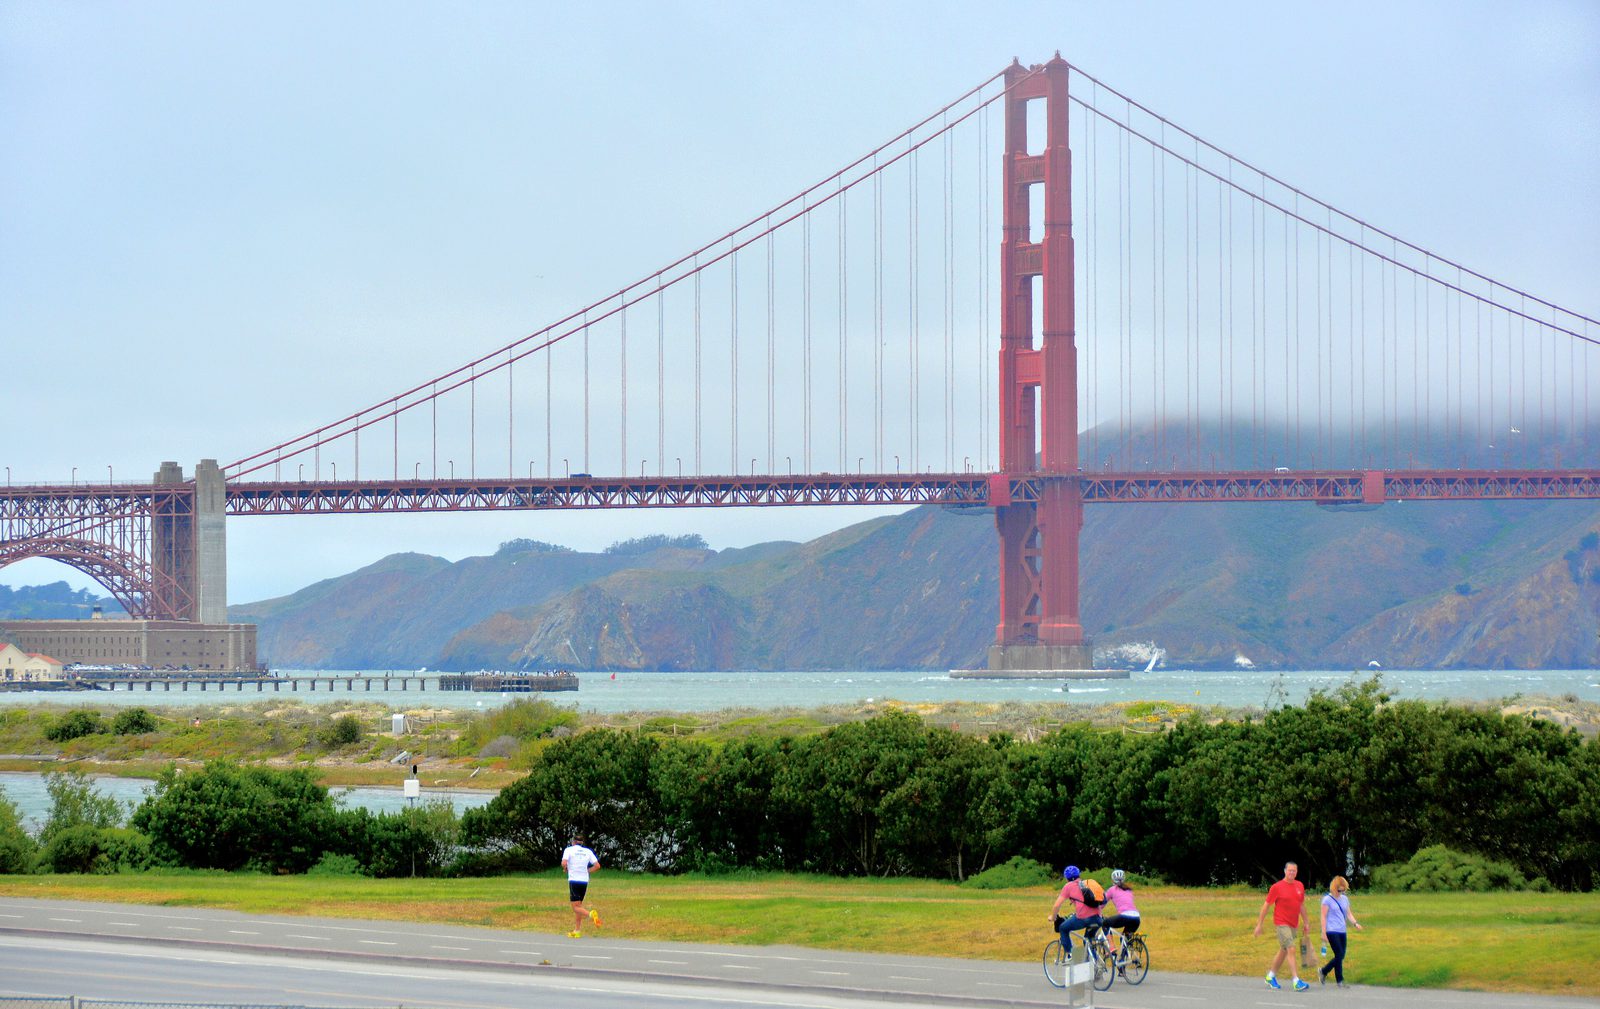

Is the water level at the Golden Gate behaving normally? What stands out, how big is it, and what should a port, marine terminal or waterfront operator check?
The answerThe tide came in and went out exactly on time, but for 48 hours every high and every low water was 23 to 39 cm higher than NOAA’s tide tables. Local air pressure was high and winds were light, so it was not a storm surge; stations from Crescent City to San Diego were running high too. The lift came from the ocean, not from the bay’s weather.
No alarm went off, and none should have. The insight was still there: the tide tables were right about when, and a foot wrong about how high.
Replay the data
Every reading below came in live through InduQT’s CSV link connector from NOAA Tides & Currents, station 9414290 San Francisco, and this is InduQT’s own replay of it: press Play, or click a numbered marker to jump to that moment. Times are UTC.
Replay of the real readings. Press Play, drag the slider, or click a numbered marker to jump to that moment. Times are UTC (San Francisco is UTC−7).
Each strip is one signal (click its name to show its trend):stronger = more (further above the tide tables, higher water, rougher water)rougher water overnight
The first reading is 0.51 m against 0.13 m predicted: 0.38 m above the tide tables before anything else happens.
Static charts of the same readings
What happened, minute by minute
- 25 Oct 23:00 The feed starts: already about 0.38 m above the tide tables.
- 26 Oct 14:00 Wave spread (the variation inside each 6-minute reading) starts rising.
- 26 Oct 19:24 Largest gap of the two days: 0.39 m above the tables.
- 27 Oct 01:18 Low water: the tables said −0.24 m, below chart datum. The gauge read +0.09 m.
- 27 Oct 06:54 Wave spread peaks at 0.066 m, about twice its usual level.
- 27 Oct 19:24 High water at 2.39 m against 2.03 m predicted.
What the data shows
On time, but a foot high
The measured tide matched the predicted curve almost perfectly in timing (correlation 0.999, about six minutes behind), but sat 0.23 to 0.39 m above it the whole time, 0.32 m on average.
Low water never got low
NOAA’s tables predicted two low tides below chart datum (negative tides). The gauge never went below +0.085 m. For anyone planning work on the foreshore around low water, the tables were a foot off.
The water got rougher overnight
Wave spread, the standard deviation inside each 6-minute reading, rose from about 0.03 m in the afternoon of 26 October to 0.066 m by the next morning.
Not the local weather
At the station itself, air pressure stayed high (1016 to 1022 hPa) and the wind light (about 3 m/s from the west and south-west). A storm surge needs low pressure or strong onshore wind; there was neither.
The whole coast was high
Over the same 48 hours, NOAA’s gauges at Point Reyes (+0.34 m), San Diego (+0.42 m) and Crescent City (+0.16 m) were also above their tide tables. A lift this wide comes from the ocean, not the bay.
Likely causes and the check for each
A coast-wide rise in ocean level
The same lift appears from Crescent City to San Diego, strongest in the south, while local pressure and wind were unremarkable. Ocean-scale effects such as warm water and offshore currents raise sea level along a whole coast for days at a time.
Check: Compare with NOAA’s coastal stations and ocean temperature anomaly maps for the same days.
Long-term sea-level rise since the tide tables’ reference period
Tide tables are referenced to a past period, and sea level at San Francisco has been rising by roughly 2 mm a year since. That explains a few centimetres of the gap, not 30.
Check: Read the station’s long-term sea-level trend on the NOAA station page.
Local storm surge
Ruled out by the station’s own instruments: high pressure and light winds throughout.
Check: None needed for these two days; keep watching pressure and wind if the gap grows.
Data, decision, judgement
Three different jobs, and InduQT does each one deliberately.
A public CSV every 6 minutes, next to the plan
InduQT pulls NOAA’s station data over a plain CSV link, the same way it reads a historian export or a lab system. Put next to the published tide tables (the plan), two days of readings tell a story that neither tells alone.
No false alarm, and the right question
The water stayed within its normal range, so InduQT’s decision engine raised no alarm: nobody gets paged for a high tide. InduQT’s diagnosis still found what mattered: the wave spread had doubled and the water was running above the predicted tide, a non-tidal influence. It named the check: local weather and sea state.
Ruling out the obvious with data you already have
That check took minutes with public data: high pressure and light winds at the station, and the whole coast running high. Not a storm, an ocean-scale lift. For an operator it means more water under the keel at low tide, a foot less clearance under bridges and cranes at high tide, and less margin before the highest tides of the year reach flood levels.
InduQT’s answer, in its own words: “Increased wave spread from 26 October 14:00, peaking on 27 October 06:54; a non-tidal influence on the water level is possible. Observed water level within its normal band. Next check: local weather, atmospheric pressure and sea-state reports for San Francisco Bay.”
The moral of the story
- Not every insight is an alarm. The most useful finding here would never have paged anyone.
- Compare the data with the plan. Here the plan is the tide tables; in a plant it is the production schedule, the recipe or the design curve.
- Rule out the obvious with data you already have: pressure and wind took a local storm off the list in minutes.
- Data, decision and judgement: InduQT keeps the data, decides without crying wolf, and points the person who knows the operation at the check that matters.
Watch this feed liveTroubleshoot your own feeds with Claude
Data: NOAA Tides & Currents, station 9414290 San Francisco, public domain, NOAA CO-OPS. The readings shown are a saved copy taken when this case was written, so the page stays complete after live data is purged. Tide predictions, air pressure, wind and the comparison stations come from the same public NOAA CO-OPS service. Readings are NOAA’s preliminary data.